The heat and running. How much sun will slow you down? (Part 2)
Hot, Slow & Toasted…!
In Part 1 of the article, I concluded that temperature and humidity cannot explain my race performances and how I felt during the races. The same goes for the dew point. I suspect either my statement is correct or the weather data is wrong.
https://therunningcat.blog/heat-and-running-part-1/
Searching historical weather data for the race locations did not reveal any surprises. The data seems to be accurate.
How is the temperature measured?
The air temperature provided in weather data is measured in the shade to give an accurate reading of the air temperature alone. To estimate the temperature you might experience while running in the sun, you can use the concept of the “apparent temperature” or “feels-like” temperature, which includes adjustments for various factors.
That explains a lot, so the weather data I used to understand the impact of the sun on my races did not reflect the reality during the race. When you run in the sun, the temperature you feel, often referred to as the “feels-like” temperature, is influenced by several factors, including air temperature, humidity, wind speed, and direct sunlight. The weather data contain a “feels-like” value, but it is the same as the temperature in the shade.
How can we factor in the sun?
The weather data also contains the following additional data: cloud cover, solar radiation, solar energy, and UV index. We can create an algorithm to adjust the temperature and get to a real “feels-like” value, factoring in all the additional weather information. Looking closer at the definitions of solar radiation, solar energy, and UV Index, I think that using solar radiation would perfectly capture the sun’s influence.

Using solar radiation (measured in watts per square meter, W/m²) instead of solar energy can provide a more precise measure of the sunlight’s intensity at a given moment. Solar radiation directly influences the feels-like temperature due to its effect on the environment and the body when exposed to sunlight.
Here’s how you can approximate the temperature you feel when running in the sun based on weather data:
Steps to Determine Feels-Like Temperature Using Solar Radiation:
- Start with Air Temperature: Take the temperature in the shade.
- Adjust for Cloud Cover:
- High cloud cover (75% or more): Minimal to no increase in temperature (add 0–3°F or 0–2°C).
- Moderate cloud cover (25–75%): Moderate increase in temperature (add 5–8°F or 3–5°C).
- Low cloud cover (less than 25%): Higher increase in temperature (add 10–15°F or 5–8°C).
3. Refine Adjustment with Solar Radiation:
- Observe the solar radiation value (W/m²) from your weather data.
- Adjust the feels-like temperature based on the intensity of solar radiation.
- Low Solar Radiation (0–200 W/m²): Minimal additional increase (add 1–3°F or 0.5–1.5°C).
- Moderate Solar Radiation (200–400 W/m²): Moderate additional increase (add 4–6°F or 2–3°C).
- High Solar Radiation (400–600 W/m²): Higher additional increase (add 7–10°F or 3.5–5.5°C).
- Very High Solar Radiation (600+ W/m²): Significant additional increase (add 10–15°F or 5–8°C).
After reading some articles online, I found the above adjustment values and used an interval. For simplicity, I will use the mean value of that interval to compare my races and the sun’s influence.
Adjusting the “feels-like” temperature for my races:
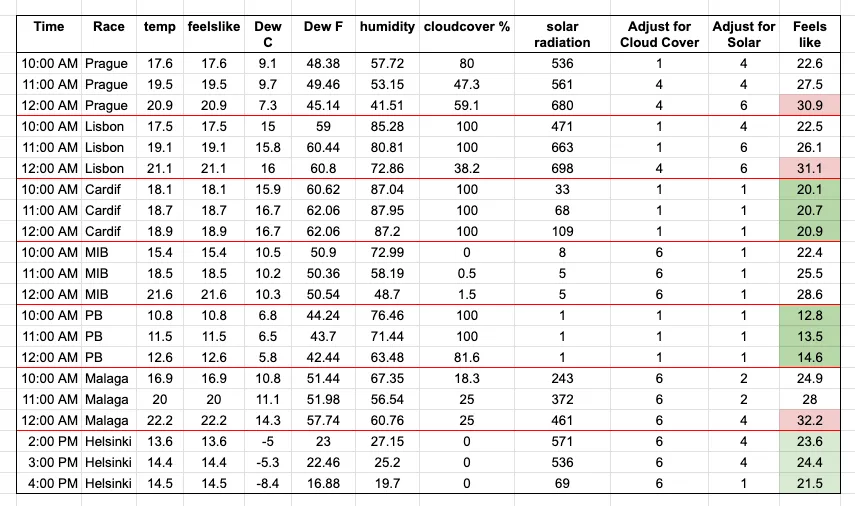
And my results, which make more sense now:
+----------+---------+
| Prague   | 1:50:12 |
| Lisbon   | 1:46:46 |
| Cardif   | 1:45:34 |
| MIB      | 1:45:35 |
| MIB PB   | 1:44:45 |
| Malaga   | 2:34:10 |
| Helsinki | 1:46:21 |
+----------+---------+
Now, the numbers are making more sense. Malaga was by far the worst race I ever ran, collapsing at the end because it was too hot and too sunny. The feels-like numbers support my theory. My PB race and Cardiff were the “coldest” races, while Prague and Lisbon matched my feelings during the race. I felt Prague was hot from start to end; at km 7, I gave up following the 1.45 pacers, while in Lisbon, after km 11, I started to feel that it was too hot.
Another test
I asked a fellow runner to name two races: one with perfect conditions in which he performed very well and one in which the weather really hindered his ability to run properly. He mentioned the Krakow HM 2021 and GoteborgVarvet 2023 (I participated in the latter, too, and it was hot).
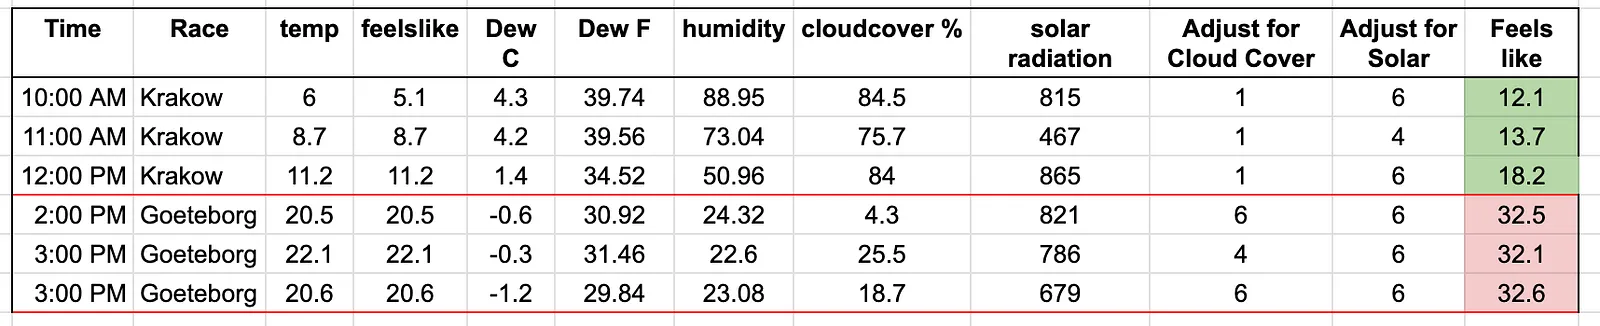
Based on this discovery and the fact that you can use Visualcrossing.com to get the forecast, which includes cloud cover estimations and solar radiation, I believe you can predict your performance for the next race. You will find out if you have conditions for a PB or if it’s a time just to enjoy the race and smile.

Thanks, and happy running!
I'm a recreational runner with an office job, testing running science on my own legs. More about me.